
By the Office of Special Education Programs
OSEP released a new OSEP Fast Facts: Educational Environments of School Aged Children with Disabilities, which explores our IDEA, Section 618 data.
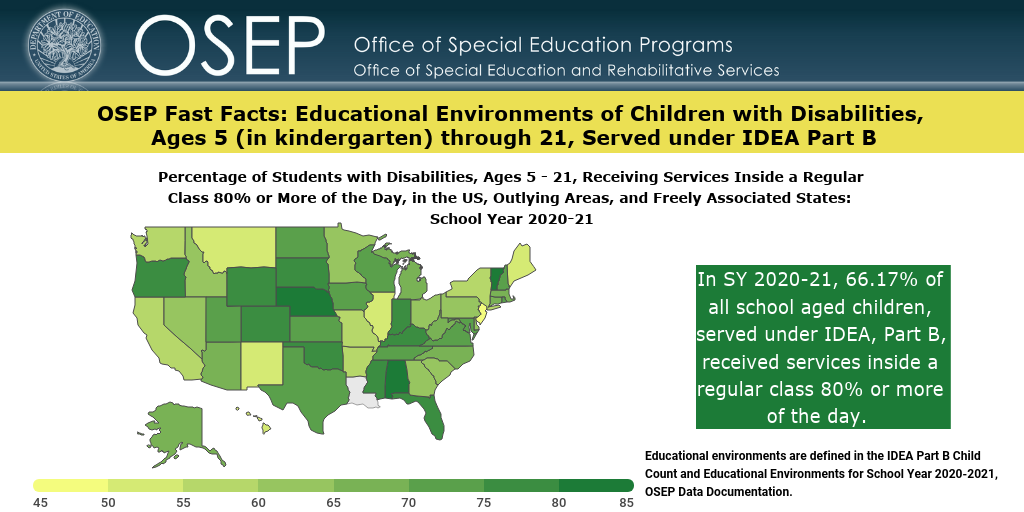
This OSEP Fast Facts takes a closer look at the environments where children with disabilities are receiving special education and related services.
Highlights from OSEP Fast Facts: Educational Environments of School Aged Children with Disabilities
- In SY 2020-21, 66.17% of all school aged children, served under IDEA, Part B, received services inside a regular class 80% or more of the day.
- Students with Intellectual Disability (17.91%) and Autism (40.77%) were less likely to receive services inside a regular class 80% or more of the day while students with Speech or Language Impairment (87.90%) and Specific Learning Disability (74.81%) were more likely to receive services inside a regular class 80% or more of the day.
- Black (3.68%) and Asian (3.48%) students with disabilities are more likely to receive services in separate schools than all students with disabilities (2.64%).
- Students who are two or more races (2.35%) and White (2.54%) students with disabilities are more likely to receive services in parentally placed private schools than all students with disabilities (1.65%).
OSEP Fast Facts is an ongoing effort to display data from the 12 data collections authorized under IDEA Section 618 into graphic, visual representations with the intent to present 618 data quickly and clearly.
Visit the OSEP Fast Facts page for existing and future Fast Facts.