Equity in Action

This was crossposted from the Institute for Education Sciences Regional Educational Laboratory West Blog.

ADVANCING EQUITY: FIVE DISTRICTS FOCUS ON IMPROVING OUTCOMES OF BLACK AND LATINX STUDENTS

It didn’t take long before the consequences of the pandemic shone a spotlight on the growing inequities within our communities and systems. Existing disparities in housing and food security, education, and health care, for example, grew wider between socioeconomic and racial groups.[1][2][3][4] At the same time, a racial reckoning across the nation was a reminder that systemic racism and injustices persist.

With compounded stress and trauma, vulnerable students and families became more at risk for disengaging from school and the school community.[5] Many school and district leaders sought to create safe and healthy environments for their students and families, who were feeling increasingly disconnected mentally, emotionally, or physically.

DISTRICTS ASK FOR HELP TO CHANGE POLICIES AND PRACTICES THAT HARM BLACK AND LATINX STUDENTS

When the Regional Educational Laboratory (REL) West led a webinar in May 2020 on strategies for engaging vulnerable students and their families during remote schooling, participants conveyed the urgency of the situation. Many in attendance raised the need to address the causes of implicit bias and systemic racism, particularly given the current climate of racial injustices. One participant said, “We have to be intentional about discussing inequities. We have to be able to call out where the challenges are and move out of our comfort zones to shift outcomes.”

“We have to be able to call out where the challenges are and move out of our comfort zones to shift outcomes.”

REL West heard from multiple district leaders, who wanted more information and guidance about asset-based strategies for reshaping their district systems and structures in order to promote equitable learning environments. Specifically, these districts wanted to know how to identify and change existing policies and practices which reinforce inequities, especially those that are barriers to success for Black and Latinx students and their families. They wanted to enact change so that Black and Latinx members of their school community will feel a greater sense of belongingness and believe that their cultural identities are valued as assets and strengths.

EQUITY IN ACTION PROJECT FOCUSES ON RACIAL EQUITY CHANGE

In response to these requests, REL West formed the Equity in Action project. The project involved five California school districts committed to racial equity change. REL West leads Erin Browder and Lori Van Houten (along with team members Margit Birge, Rebeca Cerna, and Kamilah Wilson) supported these districts through coaching and facilitation. The project aimed to help these districts:

  1. Understand the assets and needs of Black and Latinx stakeholders in their district.
  2. Learn to develop and leverage racial equity plans created by diverse district teams.
  3. Ensure that racial equity is at the center of efforts to revamp district structures and supports so that Black and Latinx students and families are engaged and thriving.

The overarching goal for these districts was to increase the safety, well-being, and engagement of Black and Latinx students and their families. More specifically, each district identified its own improvement area focused on racial equity change for Black and Latinx stakeholders and developed a theory of action for that improvement area.

Over the course of the project, the districts refined their theories of actions to focus on addressing a systemic problem. For example, one elementary school district in the Central Valley initially aimed to increase participation and engagement of Latinx families in school events by focusing on recruitment of Latinx families. Later, the district team shifted its focus to implementing culturally responsive practices that would make their schools more inviting to Latinx families and improve their sense of belonging. A second school district in Los Angeles County initially set out to establish an African American Advisory Committee (AAAC) to engage and support Black students and families primarily through more school and district events. Later, the district team shifted to supporting teachers and staff with culturally and linguistically responsive (CLR) training to implement CLR practices throughout school sites. The district team leveraged the AAAC to communicate with students and families about CLR and expected changes in adult practices at schools. “Our focus,” Browder shared, “was on addressing and changing adult practices, not ‘fixing’ students and families.”

BUILDING DISTRICT CAPACITY TO RECOGNIZE IMPLICIT BIAS AND TO CHANGE SYSTEMS AND PRACTICES

REL West designed the Equity in Action project to support these five districts through an equity-focused process. REL West facilitators Browder and Van Houten wanted to provide responsive coaching to the districts to ensure that they were meeting teams where they were. Accordingly, the facilitators utilized participant feedback and ongoing dialogue with each district’s team leads to inform the activities of the next successive coaching session toward building capacity for racial equity change.

REL West’s equity-focused process, involving a variety of knowledge- and skill-building activities, helped each district tackle its racial equity work. Initial REL West-led sessions intentionally focused on forming district equity teams that were diverse in ethnicity and roles, as well as understanding the research on important concepts of educational equity, racial equity, racial trauma, and systemic racism. These steps in the Equity in Action process enabled district teams to develop common knowledge and a shared language as they began to uncover the root causes of particular inequities. Additionally, REL West facilitators coached the district teams on how to conduct courageous conversations using conversation protocols with probing questions to examine equity mindsets and unearth bias-based beliefs.[6]

To further build the capacity of the district teams, REL West introduced equity-centered tools and processes so that teams could gather information through stakeholder interviews, map assets, and collect and summarize data to inform changes to practices and policies. Finally, through REL West coaching, each district team defined its theory of improvement for changing an adult practice, related to its identified disparity or inequity, and developed an implementation plan.

As REL West continued coaching the district teams, both individually and as a cohort, the district teams acquired an equity-focused process to replicate on their own for any racial disparities they identified. From the onset, REL West aimed to help districts prepare for and sustain equity change work as they engaged in developing and acquiring habits of goal-setting, collecting and using data to inform policy and practices, and communicating findings on racial equity to stakeholders.

DISTRICTS LEARN TO ADDRESS BELIEFS, POLICIES, AND PRACTICES THAT IMPACT RACIAL EQUITY

While the districts are still implementing new strategies to reach their long-term goals around equity, the REL West facilitators believe that the project has achieved its more immediate objectives of building district staff capacity to engage in an equity change process. “The Equity in Action participants were able to build a shared language and understanding of equity-related concepts and practices,” said Browder. Van Houten added, “And they’ll be able to apply tools and processes that they now have to other racial equity efforts.”

“The Equity in Action participants were able to build a shared language and understanding of equity-related concepts and practices.” —Erin Browder

Feedback from the district teams about the project and their capacity to work on racial change was overwhelmingly positive. Team members reported that they have gained skills to use research and data on racial equity to inform district policies and practices, as well as to communicate effectively about equity-related data and findings to families, teachers, staff, and administrators.

Many participants in the project noted these positive takeaways:

  • Having expert facilitation and knowledgeable coaching is invaluable. Coaches can help to facilitate equity-related learning, which is often new and challenging for district teams. Comments from district team members included, “It was most helpful to have experts in implementation science, with the tools to support how to go about this work. Having individualized support was very helpful.” Another participant noted, “Having a coach there to push our thinking as well as be a scribe capturing our thinking was extremely helpful.”
  • Focusing on a specific racial equity area allowed for deep exploration. By examining biases and how they shape policies and practices, the teams unpacked the causes of the inequities they want to change. One member said the process was “a great way to reflect and really dive in and learn more about this work before implementing it.”
  • Doing equity work with a diverse district team is beneficial. Forming a team that is diverse in ethnicity and roles contributes to decisionmaking informed by multiple perspectives. One team member wrote, “Coming together as a team worked really well as each one of us comes from a different background and has had different experiences and, therefore, different lenses.”
  • Collaborating with and learning from other districts is supportive. The cross-district design of the Equity in Action project provided useful support, as one participant commented, “It was nice to hear from other districts as a reminder that we’re not alone in wanting change, and that it takes time and it’s complicated.”

One lesson learned was that the work of racial equity change requires ample time. Equity team members need time to build trust, especially if they have not worked together previously on the topic of racial equity. Additionally, team sessions require sufficient time to engage deeply in all of the components of an equity-focused process.

By the end of the project’s eight months, each team had identified a theory of action, developed an implementation plan, and determined implementation and outcome benchmarks to measure progress. Van Houten confirmed, “Participants saw how all the parts of the system — beliefs, practices, and policies — fit together to address racial inequities.”

RELATED RESOURCES

The following REL West resources were developed for the Equity in Action project and may be useful resources to district teams engaging in equity change work.

Equity in Action—Tools

  • Building a District Equity Team. A worksheet with guiding questions for forming a district equity team with members representing different identities, roles, knowledge, and skills.
  • Bias-Based Beliefs Resource. A reflection protocol to guide individuals or a team through examination of biased-based beliefs and behaviors.
  • Communication and Engagement Plan. A two-part tool containing a framework, guiding questions, and worksheets for developing a communication and engagement plan with different stakeholder groups.

Equity in Action—PowerPoint slides

RELATED EVENTS

By Pamela Fong, REL West

[1] Center on Budget and Policy Priorities. (2021, October). Tracking the COVID-19 economy’s effects on food, housing, and employment hardships. Retrieved from https://www.cbpp.org/research/poverty-and-inequality/tracking-the-covid-19-economys-effects-on-food-housing-and

[2] Wolfson, J. A., & Leung, C. W. (2020). Food insecurity and COVID-19: Disparities in early effects for US adults. Nutrients, 12(6), Article 1648. Retrieved from https://www.ncbi.nlm.nih.gov/pmc/articles/PMC7352694/

[3] Pier, L., Hough, H., Christian, M., Bookman, N., Wilkenfeld, B., & Miller, R. (2021, January). COVID-19 and the educational equity crisis: Evidence on learning loss from the CORE Data Collaborative. Stanford, CA: Policy Analysis for California Education. Retrieved from https://edpolicyinca.org/newsroom/covid-19-and-educational-equity-crisis

[4] Thakur, N., Lovinsky-Desir, S., Bime, C., et al. (2020). The structural and social determinants of the racial/ethnic disparities in the U.S. COVID-19 pandemic. What’s our role? American Journal of Respiratory and Critical Care Medicine, 202. Retrieved from https://doi.org/10.1164/rccm.202005-1523PP

[5] Minkos, M. L., & Gelbar, N. W. (2020). Considerations for educators in supporting student learning in the midst of COVID-19. Psychology in the Schools, 10.1002/pits.22454. Retrieved from https://www.ncbi.nlm.nih.gov/pmc/articles/PMC7753346/

[6] Fergus, E. (2019). Confronting our beliefs about poverty and discipline. Phi Delta Kappan,100(5), 31–34.

Equity Snapshot: Apprenticeships in America

This was crossposted from the U.S. Department of Labor’s blog.

At the Department of Labor, we’re committed to advancing equity across all the programs and populations we support, including our efforts to increase awareness of and opportunities in apprenticeship — a proven industry-driven career pathway where employers can develop their future workforce and workers can get critical experience through paid and credentialed programs.

Though less common in the U.S. than in Europe, U.S. apprenticeship participation is on the rise. In fiscal year 2020 alone, 3,143 new programs were established, representing a 73% increase from 2009, and the number of active Registered Apprentices grew by 51% in the same period. And these programs are incredibly successful: 92% of apprentices retain employment after completing a Registered Apprenticeship and earn an average starting salary of $72,000.

Though apprenticeships have a proven track record of producing strong results for both employers and workers, we still have a long way to go toward advancing equity in apprenticeship participation. In this equity snapshot, we explore what data we have and what we still need to know to ensure apprenticeship programs are equitably serving all populations. Here are some of our key findings:

Though most apprentices are white, programs have become more diverse over time

According to demographic data provided by 686,000 apprentices between 2010 and 2019, 77.5% identified as white, 15.3% as Black, 2.9% American Indian/Alaska Native, 2.1% Asian, 1.6% Native Hawaiian/Other Pacific Islander, and 0.5% as multi-racial.  With regard to ethnicity, 567,000 apprentices provided information with 18.3% identifying as Hispanic.

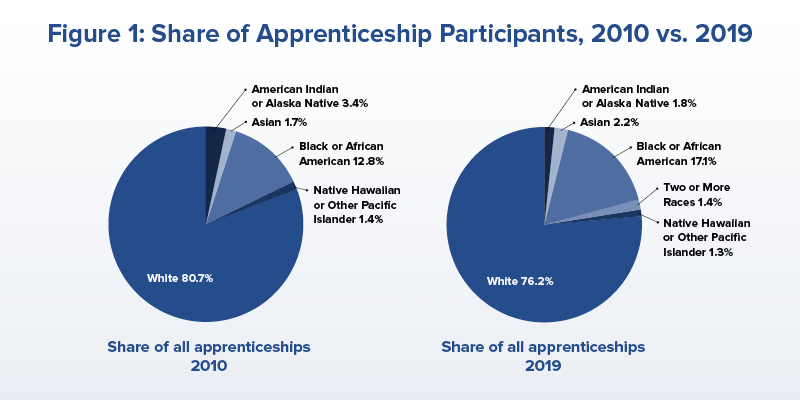
But as Figure 1 shows, apprentices have become more diverse over time. This suggests that efforts to boost participation and equity are working — but there’s still more work to be done.


Share of Apprenticeship Participants 2010 vs. 2019
 

Figure 1. Share of Apprenticeship Participants 2010 vs. 2019 (plain text)

For many racial groups, apprentice representation was higher than overall labor force participation

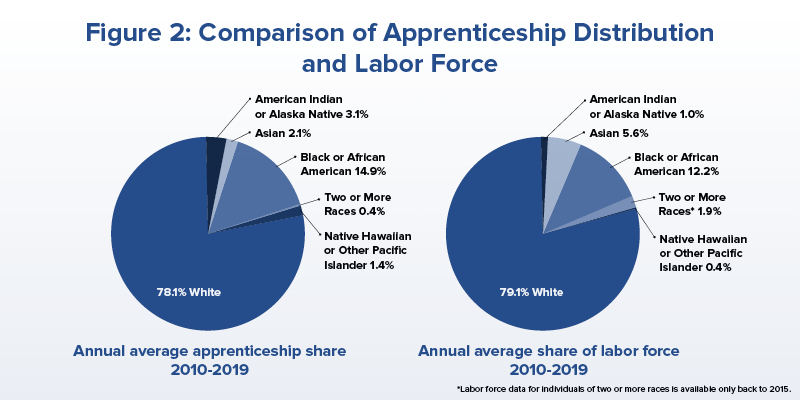
When comparing apprenticeship participation to the annual average share of labor force participation across all racial groups (Figure 2), we found Black apprentice representation was higher than their labor force representation in 17 industries, and American Indian or Alaska Native apprentices and Native Hawaiian or Other Pacific Islanders outpaced average representation in 18 industries. This includes construction apprentices, where racial group participation rates mirrored the civilian workforce.


Figure 2: Comparison of Apprenticeship Distribution and Labor Force
 

Figure 2. Comparison of Apprenticeship Distribution and Labor Force (plain text)

However, representation of Asian apprentices and apprentices of two or more races fall well below their labor force share

Though some apprentice groups outpaced their peers in the general labor force, this was not the case for Asian apprentices. Whether these issues are structural we aren’t able to address, but we did identify two important issues to note: First, the grouping of Asian sub-groups into a single category may mask additional inequities among these various sub-groups. Second, there are possible identification issues associated with apprentices of two or more races, since survey respondents may self-select into a single racial group without being made aware of the multi-racial category — both of which should be addressed by follow-up surveys to correct and update the data.

Hispanic representation among apprentices is on the rise

Apprentices identifying as Hispanic represented 18.3% of all apprentices from 2010-2019, with an average annual proportion of 15.5%. Hispanic representation among apprentices has been increasing between 2010 and 2019, with the largest jump in representation in 2017 from 14.4 to 22.4%.  The overall labor force participation of Hispanics during this time was 16.3%, demonstrating that that though Hispanics hare overrepresented in Registered Apprenticeship programs, they have historically been underrepresented in the labor force overall.

Black apprentices are less likely to complete apprenticeship programs than their white peers

From an equity standpoint, there should be no significant difference in apprenticeship completion rates for individuals of various racial groups or by gender, but our data indicated that this is not the case. While completion rates are below 35% for all racial groups, which speak to the general difficulty of apprenticeships, completion rates for White apprentices reached 33% but only 24% for Black apprentices. Asian apprentices are the only other group to eclipse 30% completion, which suggests that there are factors in play that are negatively affecting completion equity.

Women make up only a small portion of apprentices

Historically, women have not been well represented in apprenticeship programs or in construction industries (where many apprenticeships exist) in general. Between 2010 and 2019, women accounted for an average of 8.5% of apprentices, and only 3.5% of construction apprentices. One study indicated that difficulties securing childcare and lack of pay for classroom instruction were significant barriers to participation and completion of apprenticeship programs – a common narrative for not only apprenticeships, but labor force participation in general.

Additional data is necessary to conduct a full equity analysis

Though our analysis yielded some helpful insights, we uncovered gaps in available data, making a full analysis of apprenticeship equity difficult. For example, we are only able to collect demographic information from program participants and not from applications, and the percentage of apprentices who did not provide demographic information recently jumped from 0 to 10 percent, leaving us with an incomplete picture of the full apprenticeship landscape.

Additionally, as mentioned above, our existing data can’t tell us which Asian and Hispanic sub-groups apprentices identify as, which is necessary to identify and address systemic issues facing these groups. And finally, racial groups are not uniformly distributed across the United States, meaning that we should account for geographic concentrations of various populations to get a better sense of apprenticeship accessibility and labor mobility.

These are just a few examples of what we know (and what we don’t) when it comes to assessing equity across apprenticeship programs. We can’t address what we don’t measure and improving the collection and quality of our data will help us better identify where we are making progress and where we need to improve — in our apprenticeship programs and beyond.

Read our full Apprenticeship Equity Snapshot Memo here.

Janelle Jones is the chief economist, Alexander Hertel-Fernandez is the deputy assistant secretary for research and evaluation, and Christopher DeCarlo is an economist at the U.S. Department of Labor.


Figure 1. Share of Apprenticeship Participants 2010 vs. 2019

Racial Group Share of All Apprenticeships 2010 Share of All Apprenticeships 2019 Percent Change in Apprenticeship Share
American Indian or Alaska Native 3.4% 1.8% -46.3%
Asian 1.7% 2.2% 27.9%
Black or African American 12.8% 17.1% 33.3%
Two or More Races 0.0% 1.4% 3248.1%
Native Hawaiian or Other Pacific Islander 1.4% 1.3% -6.4%
White 80.7% 76.2% -5.6%


Figure 2. Comparison of Apprenticeship Distribution and Labor Force

Racial Group Annual Average Apprenticeship Share
2010-2019
Annual Average Share of Labor Force
2010-2019
Change in Share of Labor Force
2010-2019
American Indian or Alaska Native 3.1% 1.0% 43.8%
Asian 2.1% 5.6% 35.8%
Black or African American 14.9% 12.2% 8.7%
Two or More Races* 0.4% 1.9% 20.8%
Native Hawaiian or Other Pacific Islander 1.6% 0.4% 40.6%
White 78.1% 79.1% -4.8%

(*) Labor force data for individuals of two or more races is available only back to 2015.

Recognizing 2021 Hispanic National Blue Ribbon Schools

Since 1982, the National Blue Ribbon Schools Program has recognized public and private schools based on their overall academic excellence or progress in closing the achievement gap among student subgroups. Each year the U.S. Department of Education celebrates the achievements of these great American schools. Throughout its 38-year history, the program has recognized over 9,000 schools and this year, the National Blue Ribbon Schools Program recognized 325 schools nationwide. Of the 325 schools, 38 honorees are schools serving a Hispanic student population ranging from 40 to 100 percent, located in 11 states.

Hispanics make up 27.2 percent of all K-12 public school students. These National Blue Ribbon Schools are leading the way in preparing Hispanic students for academic success. The White House Initiative on Advancing Educational Equity, Excellence, and Economic Opportunity for Hispanics (Initiative) celebrates each one for this national recognition. The Initiative congratulates the administration, staff, teachers, families, and communities that collaborate to ensure Hispanic students are succeeding. These schools are models for other schools with a high or growing Hispanic population on achieving excellence in academic achievement and closing academic gaps. The variety of programming within these schools demonstrates that when students are placed in the education setting that best fits them, excellence follows. The Initiative looks forward to further highlighting these schools and sharing their success.

The 2021 National Blue Ribbon Schools with a high Hispanic student population are:

School City State
Desert View Academy Yuma AZ
Franklin East Elementary School Mesa AZ
Mesquite Elementary School Tucson AZ
University High School Tolleson AZ
Dr. T. J. Owens Gilroy Early College Academy Gilroy CA
Red Hawk Elementary School Temecula CA
North Valley Middle School La Salle CO
AcadeMir Charter School Middle Miami FL
Center for International Education a Cambridge Associate School Homestead FL
Somerset Academy Silver Palms Homestead FL
Hills Elementary School Hills IA
Disney II Magnet High School Chicago IL
Prosser Career Academy High School Chicago IL
Sampson Early College High School Clinton NC
John F Kennedy Elementary School Jamesburg NJ
Coronado Elementary School Hobbs NM
Mesquite Elementary School Mesquite NM
PS 249 Caton (The) Brooklyn NY
Achieve Early College High School McAllen TX
A. P. Beutel Elementary School Lake Jackson TX
Calder Road Elementary School Dickinson TX
Clendenin Elementary School El Paso TX
Gallegos Elementary School Brownsville TX
Hawkins Elementary School El Paso TX
Hidalgo Elementary School Hildalgo TX
Kathlyn Joy Gilliam Collegiate Academy Dallas TX
Lamar Elementary School El Paso TX
Mittie A Pullam Elementary School Brownsville TX
North Houston Early College High School Houston TX
Porter Elementary School Mesquite TX
Ramona Elementary School El Paso TX
South Texas ISD Rising Scholars Academy San Benito TX
South Texas Preparatory Academy Edinburg TX
Spearman Junior High School Spearman TX
Trinidad “Trini” Garza Early College High School At Mountain View Dallas TX
Vista Hills Elementary School El Paso TX
Young Women’s Leadership Academy San Antonio TX
Zeferino Farias Elementary School Alamo TX

In addition, the Department annually recognizes outstanding school leaders from National Blue Ribbon Schools through the Terrel H. Bell Award. This award recognizes principals for their vision and collaborative leadership style that have transformed their schools. This year, the Department recognized eight remarkable principals. Four of the principals are from National Blue Ribbon Schools with a high Hispanic student population.

The Initiative congratulates the school leaders, principals, support staff, and teachers for their achievements as 2021 National Blue Ribbon Schools honorees.

Build Back Better for Latino Americans

This post was crossposted from the U.S. Department of Education blog, Homeroom.

Blog by Eloy Oakley, Senior Advisor 

President Biden has a bold vision for the future of country in his Build Back Better agenda, and critical education investments like the free community college and advancing affordability proposals are about opening opportunity for all Americans. As we close out National Hispanic Heritage Month, it’s also a time to celebrate what these proposals would mean for Latino students trying to pursue a postsecondary degree or certificate.

And there’s a lot to celebrate. The President’s proposal would make community college free for students who pursue a certificate or degree, attend college at least half-time, and qualify for in-state tuition (or would qualify but for their immigration status). Our nation’s community colleges are the gateway to an affordable, quality education for the majority of Latino students in higher education. The free community college proposal would provide more than $4,500 per full-time student, with the federal government initially covering the full amount and covering at least 75 percent once the program is fully phased-in, to states in exchange for making community colleges free to attend. If all states participate, this ambitious plan will extend opportunities to millions of students across over 1,000 institutions of higher education.

Additionally, the Advancing Affordability for Students (AAS) proposal will provide eligible students from low- and middle-income families, including DREAMers, two years of subsidized tuition at a four-year Historically Black Colleges and UniversitiesTribal Colleges and Universities, or Minority-Servicing Institutions (MSIs), such as  Hispanic-Serving Institutions (HSIs) and Asian American and Native American Pacific Islander-serving Institutions (AANAPISIs) – either as first-time students or as transfer students.

The Build Back Better agenda is a once-in-a-generation opportunity to invest in our Latino students. In addition to the $1,875 increase to the maximum Pell Grants (almost half of all Hispanic students receive Pell Grants), we project that, if all states participate, the plan would:

  • Eliminate tuition and fees for the nearly 55 percent of all Hispanic postsecondary students who are enrolled in community colleges;
  • Include over 90 percent of Minority-Serving Institutions in the free community college and AAS proposals combined;
  • Include institutions that serve half of all undergraduate students, including about 70 percent of Hispanic students, across both of those proposals.

The pandemic has hit Main Street much harder than Wall Street, and working families have struggled to gain a foothold in the pandemic economy. Students from communities of color and low-income communities are disproportionately impacted by this reality. Hispanic individuals saw people saw the largest declines in employment of any group due to the pandemic, and their unemployment rates remain more elevated today. Importantly, the benefits of free community college tuition will be designed to support all Americans, but will promote equitable access and a path to upward mobility especially for students of color and those from lower-income families. In cities both urban and rural, hardworking Americans are looking for livable wage paying jobs that can support their families, and postsecondary credentials are more important than ever for our learners and workers to be competitive in our labor market and help drive our economy. The challenge for everyday Americans is that for many, a college education or career training has not been within reach for them.

Community colleges have long served those who need it most: students juggling work and life along with school, students who are supporting their own children’s education, students who are experiencing poverty and weighing the option of education versus another part time job to pay the bills, students who are English language learners and immigrants to our country, students who may be incarcerated or who are in reentry following incarceration, and so many more.

As a parent, working learner, and product of a community college myself, I can clearly attest to the value of a community college education—not only for me, but for my entire family. President Biden’s Build Back Better agenda provides for the kind of opportunity that I received to so many more Americans. And given the challenges that most everyday Americans have endured during the last 18-months, they deserve it.